Research · evidence checked Sep 9, 2026
How Blask’s iGaming market-intelligence metrics work
Blask publishes external demand and modeled benchmark signals; operators should interpret them alongside internal, financial and regulatory evidence.
- Written by
- Gaming Elite Network Editorial Team
- Reviewed by
- Gaming Elite Network Editorial Team
- Published
- Last material update
- Evidence checked
- Next review
- Editorial state
- approved

What do Blask’s metrics measure?
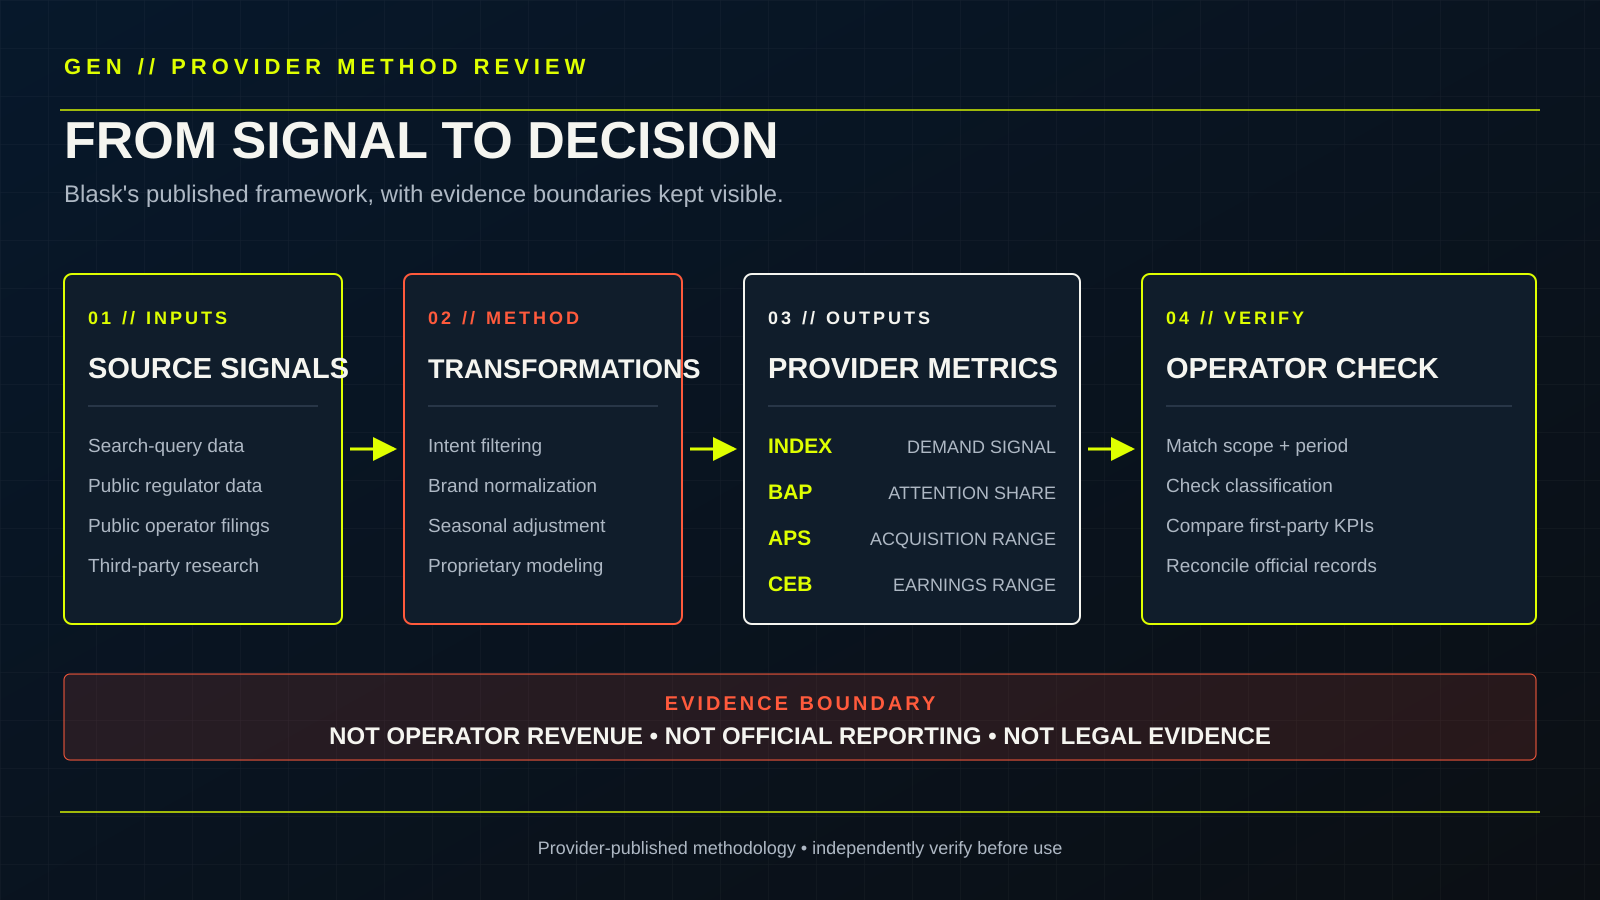
Blask’s published framework turns external demand signals and other market inputs into comparative indicators for iGaming markets and brands. The outputs can help frame questions about attention, acquisition potential, and modeled earnings, but they are not a replacement for an operator’s analytics, accounts, or regulator filings.
That distinction matters. A modeled external benchmark and a completed financial result answer different questions. A useful operator workflow compares them; it does not relabel one as the other.
This maintained record is deliberately limited to Blask’s four brand-level metrics: Blask Index, BAP, APS, and CEB. The provider’s current methodology page also describes a separate game-metrics layer. GEN has not extended this article’s definitions or decision rules to those game-level measures.
The four core brand metrics
| Metric | Provider-published meaning | It should not be read as |
|---|---|---|
| Blask Index | A normalized, search-based demand indicator for a brand or market | GGR, revenue, website traffic, visits, or raw Google Trends data |
| BAP | A brand’s percentage of total tracked market attention for a country and period, calculated from Blask Index values | GGR or NGR market share |
| APS | A modeled acquisition benchmark presented as a minimum, average, and maximum range | The operator’s actual first-time-depositor count |
| CEB | A modeled earnings baseline presented as a minimum, average, and maximum range | Reported revenue, operator P&L, or reported GGR |
Blask publishes the BAP formula as the brand’s Blask Index divided by the market’s Blask Index, multiplied by 100. APS and CEB add further provider modeling. Their ranges communicate uncertainty, but a range does not make the underlying assumptions independently verified.
How does the provider describe its data pipeline?
Blask says its foundation is a share-of-search method. Its published process includes geographically tagged search-query data, intent filtering, brand-name normalization, repeated collection to account for source revisions, and seasonal adjustment. The provider lists Google Keyword Planner and Google Trends, public regulatory disclosures, gambling-commission reports, public operator filings, third-party research, and proprietary modeling among its inputs.
The pipeline has several evidence classes. Search activity is an observed external signal. Public filings and regulator reports are documentary inputs. Cleaning, classification, weighting, acquisition conversion, and earnings estimation are transformations. A buyer should keep those layers separate when assessing confidence.
Why does CEB use different paths?
Blask says it classifies brands in regulated markets as local or international for its CEB calculation. For locally licensed brands, it describes anchoring the market model to regulator-published GGR where available, with public operator financial information as another possible calibration point. For international brands, where comparable public financial data may be unavailable, it describes using behavioral signals and regional revenue-per-user benchmarks. In unregulated markets, the provider says it combines modeled demand and comparative economic inputs.
These descriptions come from Blask. Gaming Elite Network has not audited the classification coverage, source completeness, weights, error distribution, or model performance. A regulator figure used as an input does not turn every downstream estimate into official regulatory data.
What should an operator verify before using the metrics?
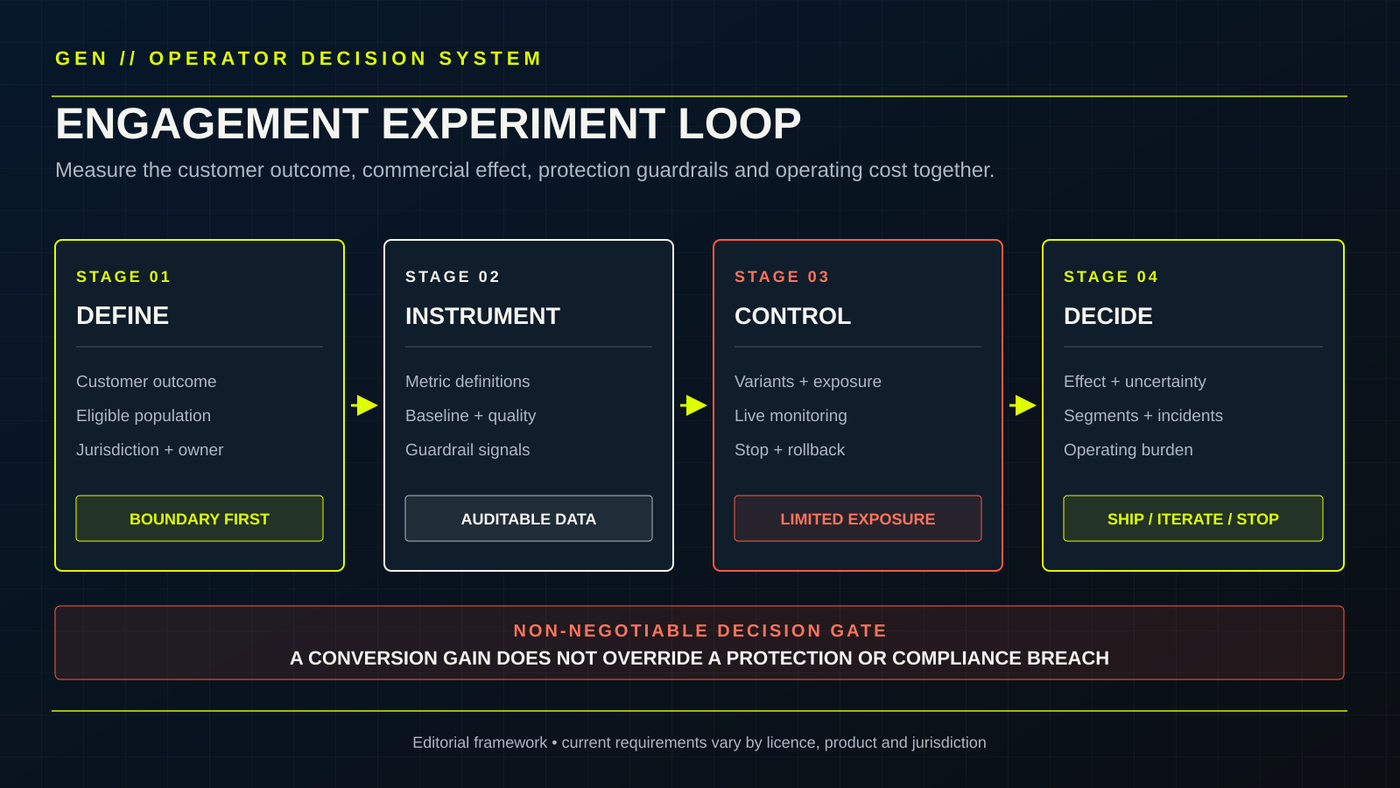
Use a dated evidence note for every decision. At minimum, record:
- The country, vertical, brand set, period, and data granularity being compared.
- Whether each brand is classified as local, international, mixed, or outside the intended operating scope.
- The metric definition and methodology version in effect on the retrieval date.
- Whether the value is observed, calculated, modeled, or presented as a range.
- Which internal KPI or public regulator series will be used as a comparison—not as an assumed equivalent.
- The decision threshold and what evidence would contradict the initial interpretation.
For example, an increase in BAP can support a hypothesis that tracked search attention has shifted. It cannot, by itself, establish that deposits, net gaming revenue, retention, or market share by GGR increased. Those claims require their own evidence.
Where are the main limitations?
The public methodology explains important inputs and definitions, but it does not expose enough of the proprietary transformation pipeline for GEN to reproduce each value independently. Coverage, query classification, brand matching, licensing classification, calibration data, and benchmarks can all affect the result. Method changes can also limit comparisons across time unless the provider supplies a consistent historical series or restatement policy.
Search demand has another practical boundary: attention can exist outside a brand’s permitted or active market footprint. Blask describes a non-domestic-usage indicator for this situation. Operators should treat licensing and availability as separate verification tasks and obtain qualified legal advice for jurisdiction-specific questions.
Frequently asked questions
Is Blask Index a revenue measure?
No. Blask defines it as a normalized, search-based demand signal. It is not GGR, revenue, website traffic, visits, or raw Google Trends data.
Is BAP the same as GGR or NGR market share?
No. The provider defines BAP as a brand’s share of the tracked Blask Index for a country and period. Financial market share requires separately scoped GGR or NGR evidence.
Are APS and CEB actual operator results?
No. Blask presents APS and CEB as modeled ranges. Operators should compare them with first-party acquisition data, finance records, and relevant public reporting rather than treat them as completed results.
Does Blask’s local or international label prove a brand’s licence status?
No. It is an input to the provider’s CEB calculation, not legal or regulatory evidence. Check the relevant regulator’s current register and obtain qualified advice where needed.
The decision rule
Use Blask metrics as provider-modeled external market signals. Reconcile them with first-party funnel data, finance records, public regulator data, campaign timing, and market events. If the sources disagree, investigate the definitions and scope before acting. Do not average incompatible measures into a false consensus, and do not use the framework as sole evidence for a financial, compliance, or legal conclusion.
GEN’s methodology explains how we label provider-supplied claims, separate evidence from interpretation, and maintain review dates. This page keeps the relevant metric definitions and source limitations together in one maintained record.
Visual analysis
Source record and operator framework
The first visual fixes the sourced facts. The second turns those facts into a practical review or decision path.
Evidence record
Sources used on this page
Each source supports a defined claim. Provider pages are identified as provider-supplied evidence.
- How Blask measures, calculates, and presents iGaming market intelligenceBlask · accessed Sep 9, 2026
The provider defines its data inputs, normalization process, four brand metrics, calculation paths, stated exclusions, and a separate game-metrics layer on its page updated 9 April 2026.
- How to measure casino brand performanceBlask · accessed Sep 9, 2026
The provider explains how it positions Blask Index, BAP, APS, and CEB relative to internal operator performance measures on its page updated 25 May 2026.
- Blask's path to a metrics framework for local and international iGaming brandsBlask · accessed Sep 9, 2026
The provider describes different CEB inputs for locally licensed and international brands and the role of regulatory data on its page updated 27 May 2026.